
Please, take a good look at the graphic truth about public education in America.
National leaders and much of the media repeatedly call the system “failed.” That is their version of the graphic truth. They point to test scores as “evidence.” President Trump described the institution as an …
“education system flush with cash but which leaves our young and beautiful students deprived of all knowledge.”
That’s disturbing. Also disturbing is this reporters response to Trump’s “facts” in Trump’s vision of education begins and ends with schools being bad.
“… it’s true that the United States spends quite a bit, relatively speaking, on education, and test results are fairly disappointing.”
But let’s dig deeper into the Trump/DeVos “facts.”
Look closer at the Graphic Truth About Spending and Outcomes
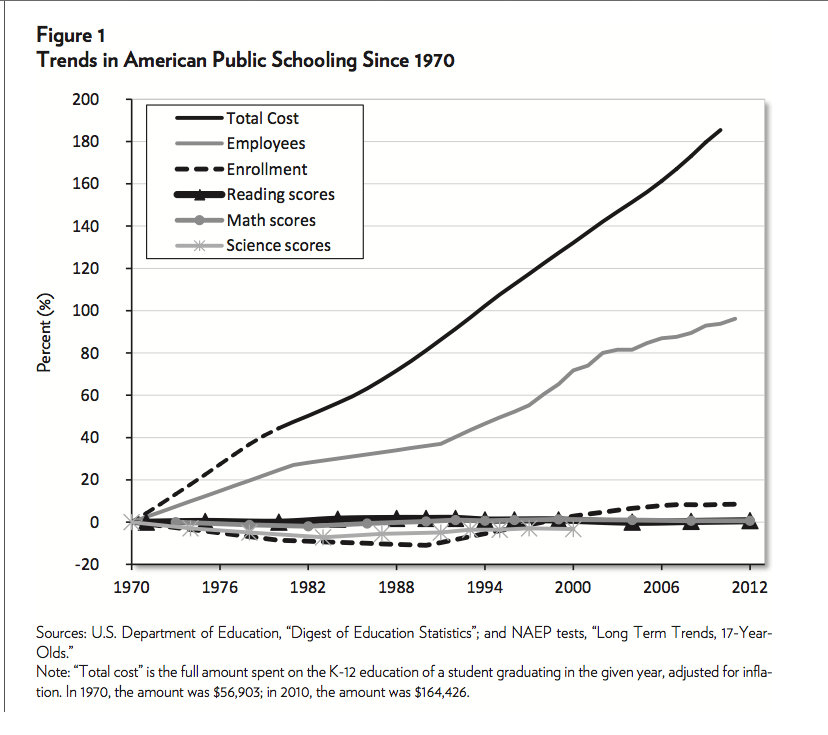
For now, ignore test scores and ask WHY have costs risen dramatically?
Total costs DID rise dramatically. So did employees. But why?
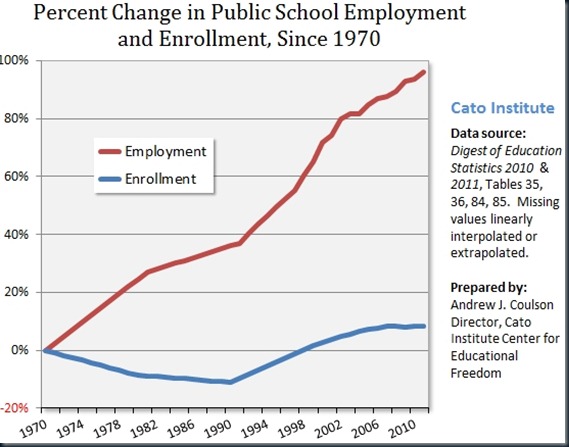
Since roughly 1992, an Employment/Enrollment GAP developed.
Blame the teacher’s union? Not so fast. Look closer at “The Other Half.”
“America now spends a greater percentage of its education funding on non-teachers than any other country in the world besides Denmark.” CBS News
And the Graphic Truth About Our Education “Outcomes”?
In the news article previously referenced, the reporter states that…
“…tests that try to measure how American students stack up to their peers show that the US is far from No. 1. On the Program for International Student Assessment (PISA). … American 15-year-olds scored as average in science and reading and were below average in math.”
Below average in math is what makes the headlines. But to this reporter’s credit, she also stated that…
“Another test with different methodology found American students fared better but still scored below Singapore, Japan, Korea, and Russia.”
That other “test” she referred to is TIMSS (Trends in Math and Science Study). It is a study with test results being ONLY one portion of the study —the only portion that makes the news.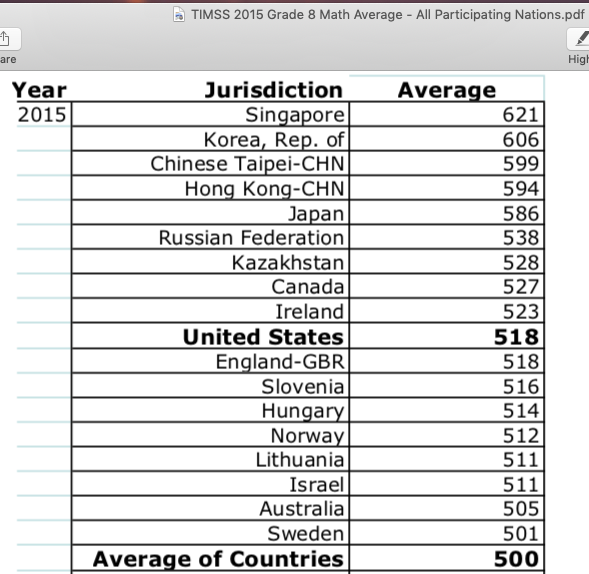 How about progress on our own national test (NAEP – National Assessment of Educational Progress)?
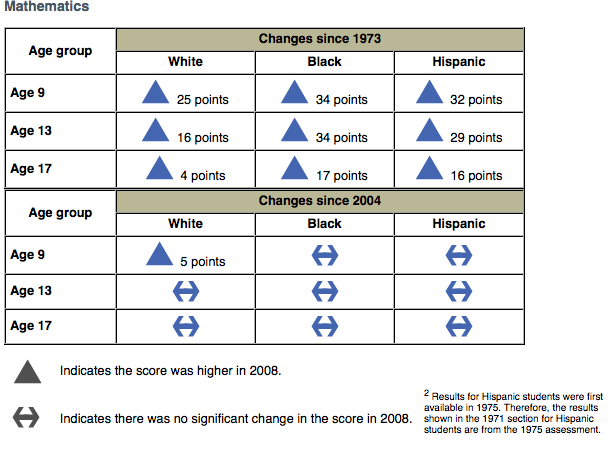
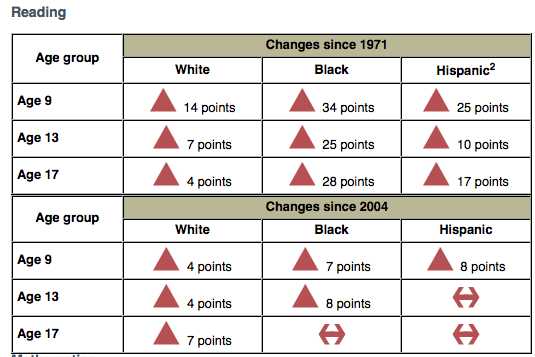 We made huge progress — until we stalled.
And now, the public education system must defend itself against its current education secretary, Betsy DeVos, who sees traditional public schools as “a dead end.” She, and our other political leaders, need to see the graphic truth about our national progress in a broader historic perspective.
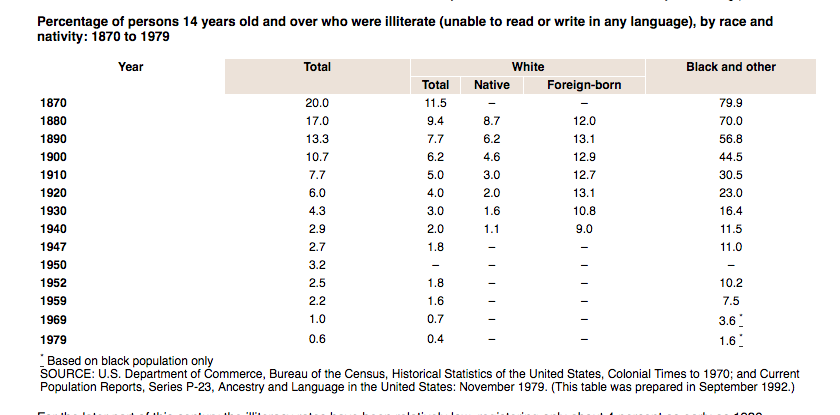
We fought ILLITERACY – From 20% functionally illiterate down TO 0.6 – and were winning that fight before the NCLB-style costly “reforms.”
A dead end system? Hardly.
Ending illiteracy was a primary reason for developing the public education system. Progress was most definitely made …. until it wasn’t!
This graph was made to help justify No Child Left Behind style reforms. NOW, it should be used to demonstrate WHY “NO CHILD LEFT BEHIND” WAS SUCH A COSTLY FAILURE.
*Now, here’s a MUST KNOW Small but Essential Piece of Education Reform History*
During the 60’s, the nation began making universal efforts (through the force of law) to offer educational opportunity to ALL of America’s children.
To help monitor our progress towards that goal, NAEP was designed to provide a randomized sample of education-related information. NAEP provided statistics for researchers to monitor and help guide the nation’s schools towards equal access to quality education. It was not a tool for ENFORCING accountability where it matters most. Unfortunately, the scores have become a weapon.
So if you look back at the colored NAEP charts, you can see that the country was indeed showing MARKED improvement in basic reading and mathematics skills for groups of children that typically were being under-served (disadvantaged groups). And we were making this progress without detriment to the majority group. That was exactly what we wanted to be doing.
Given what was happening in schools and society at the time, a “flat-line” in the early years of NAEP was perfectly acceptable. But yes, we believe it isn’t good enough to remain educationally stagnant especially with such dramatically increasing costs. However, that is why the public needs to understand a bit more of the politics behind the statistics.
Where Congress Took A Wrong Turn
In 1976, Congress began the policy change FROM federal funding focused on meeting the needs of disadvantaged children TO funding achievement in “basic academic subjects.” That took the public’s focus off indicators of educational equity and quality and put it on the simplistic (and misleading) measure of higher test scores.
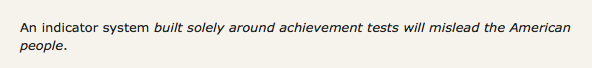
This was a WARNING! September 1991: Education Counts: An Indicator System To Monitor the Nation’s Educational Health. … A Warning IGNORED.
By 1992, standards-based (Outcome-Based) education had taken over the states. Education reform plans were “built solely around achievement tests.”
And it didn’t take long for the money-making predators in the education industry to see where profits were to be made. The public was told the restructuring of schools was for our own good — to remain economically competitive internationally. The reality: those selling “education products” benefited most.
The quest for higher “scores” in basic subjects cost the nation in multiple ways.
Truth Be Told: Education is more than a score!
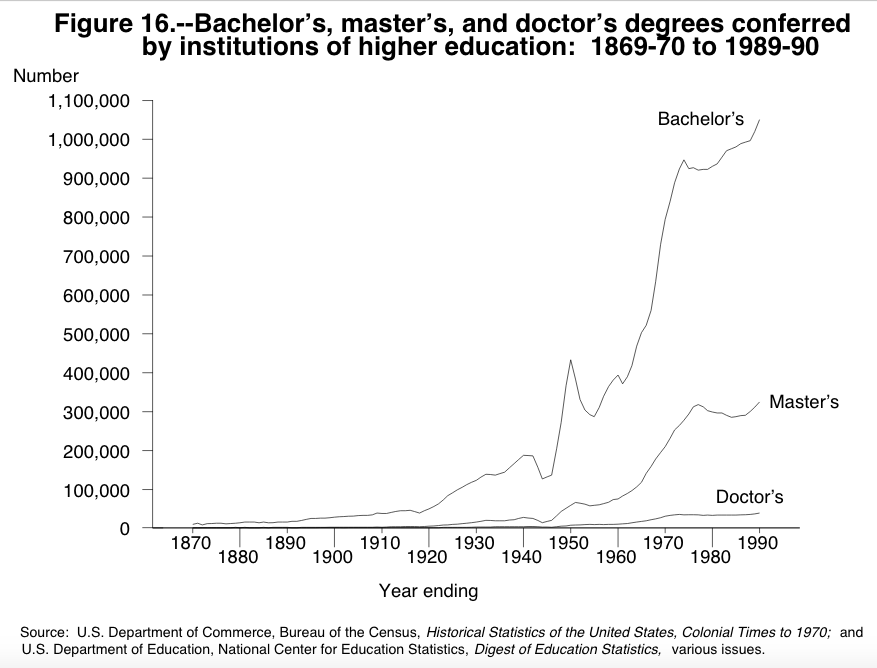
Before the Corporate-Political Take-Over, U.S educational attainment had skyrocketed.
Before political and corporate leaders pushed their reforms on this nation, we led the world in higher educational attainment.
This Graphic Truth was provided by Sandia National Researchers in 1991.
And after the federalization (NCLB) of Outcome-Based Education Reform???? Look at the graphic truth. From 2000 to 2017, we went FROM being second only to Canada (U.S. 36% to their 40%) TO having three other countries surpass us and two others that have caught up to us!
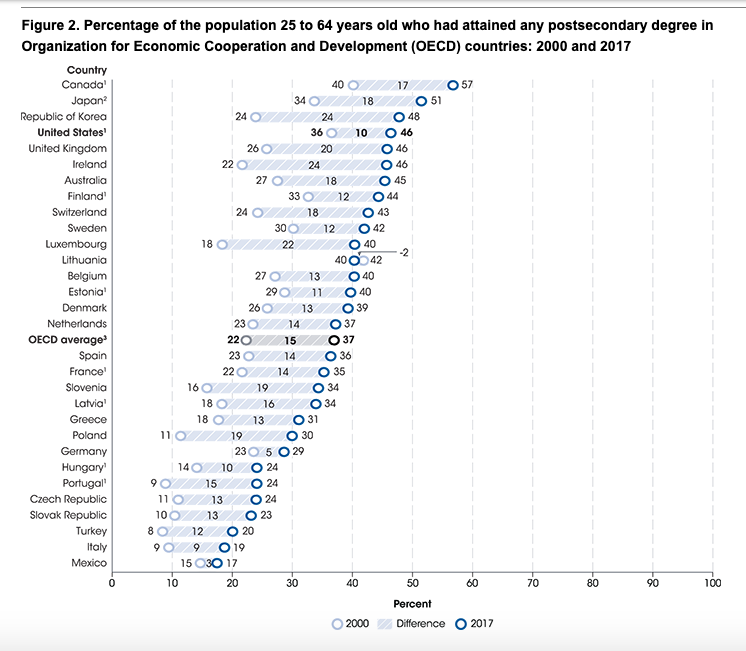
Source: The Condition of Education
We were TOLD we needed “higher standards” and they must be “benchmarked” internationally (Common Core).
Yet, we had cultivated educational excellence in our best and brightest —in this country— without common national standards.

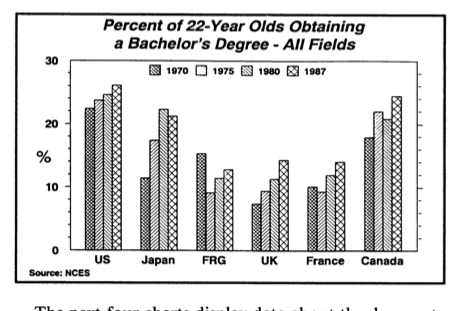
This Graphic Truth is provided by Dr. David Berliner.
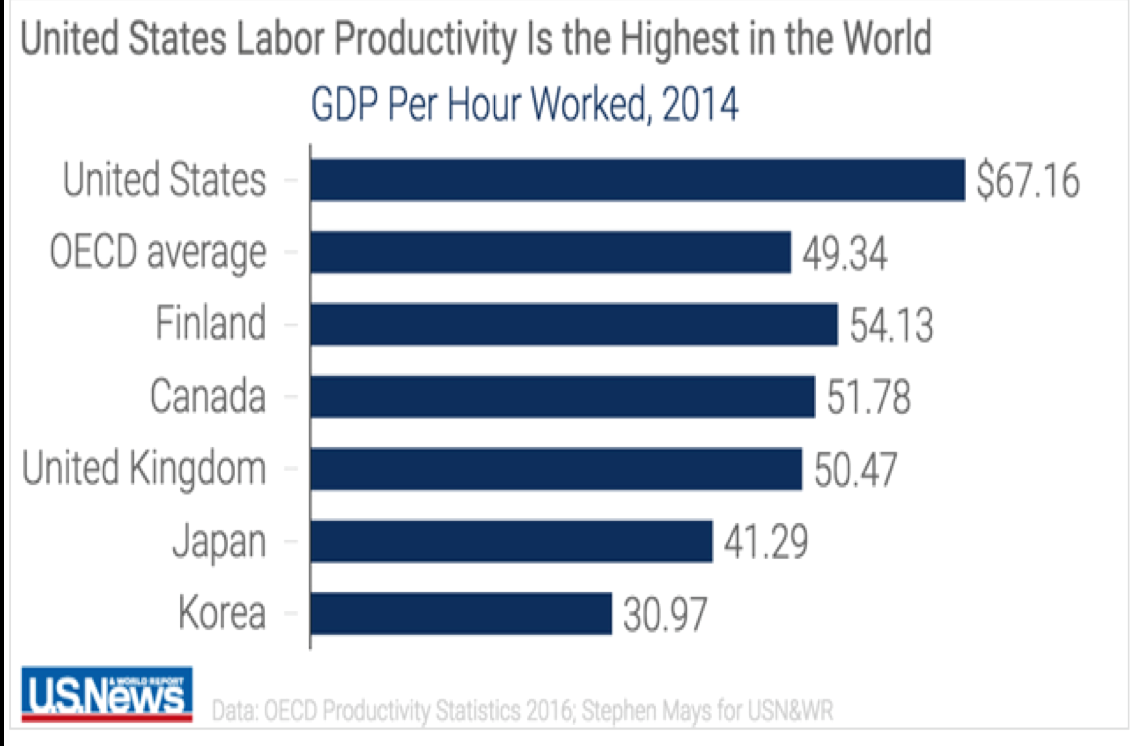
So why would we want to “benchmark” basic academic standards to these other countries? … ?
We are a productive people.
This Graphic Truth is provided by Dr. David Berliner.
And before No Child Left Behind (2001) and Common Core (2010) wreaked tyranny upon the local control of education, most PARENTS were satisfied with their local public schools.
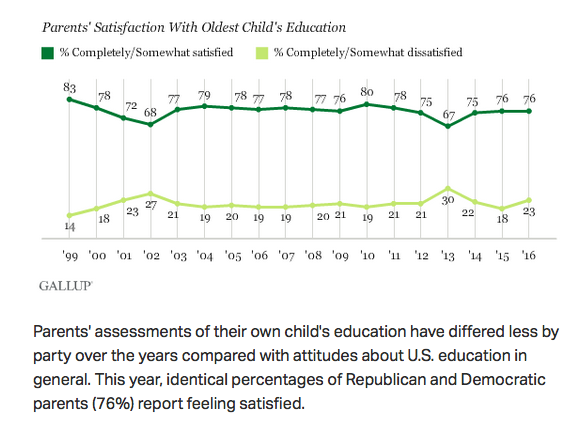 Politicians and other leaders —with political and monetary agendas— disrupted our educational progress, upset parents and teachers, and decreased the quality of education for many children. They restructured our schools into a standardized, outcome-focused gutted version of what was a great system.
That is what we have allowed.
A Call To Action is Overdue
If this country now wishes to stop the destruction of public schools, we have to take action. The current leadership has no intention of preserving and improving public schools.
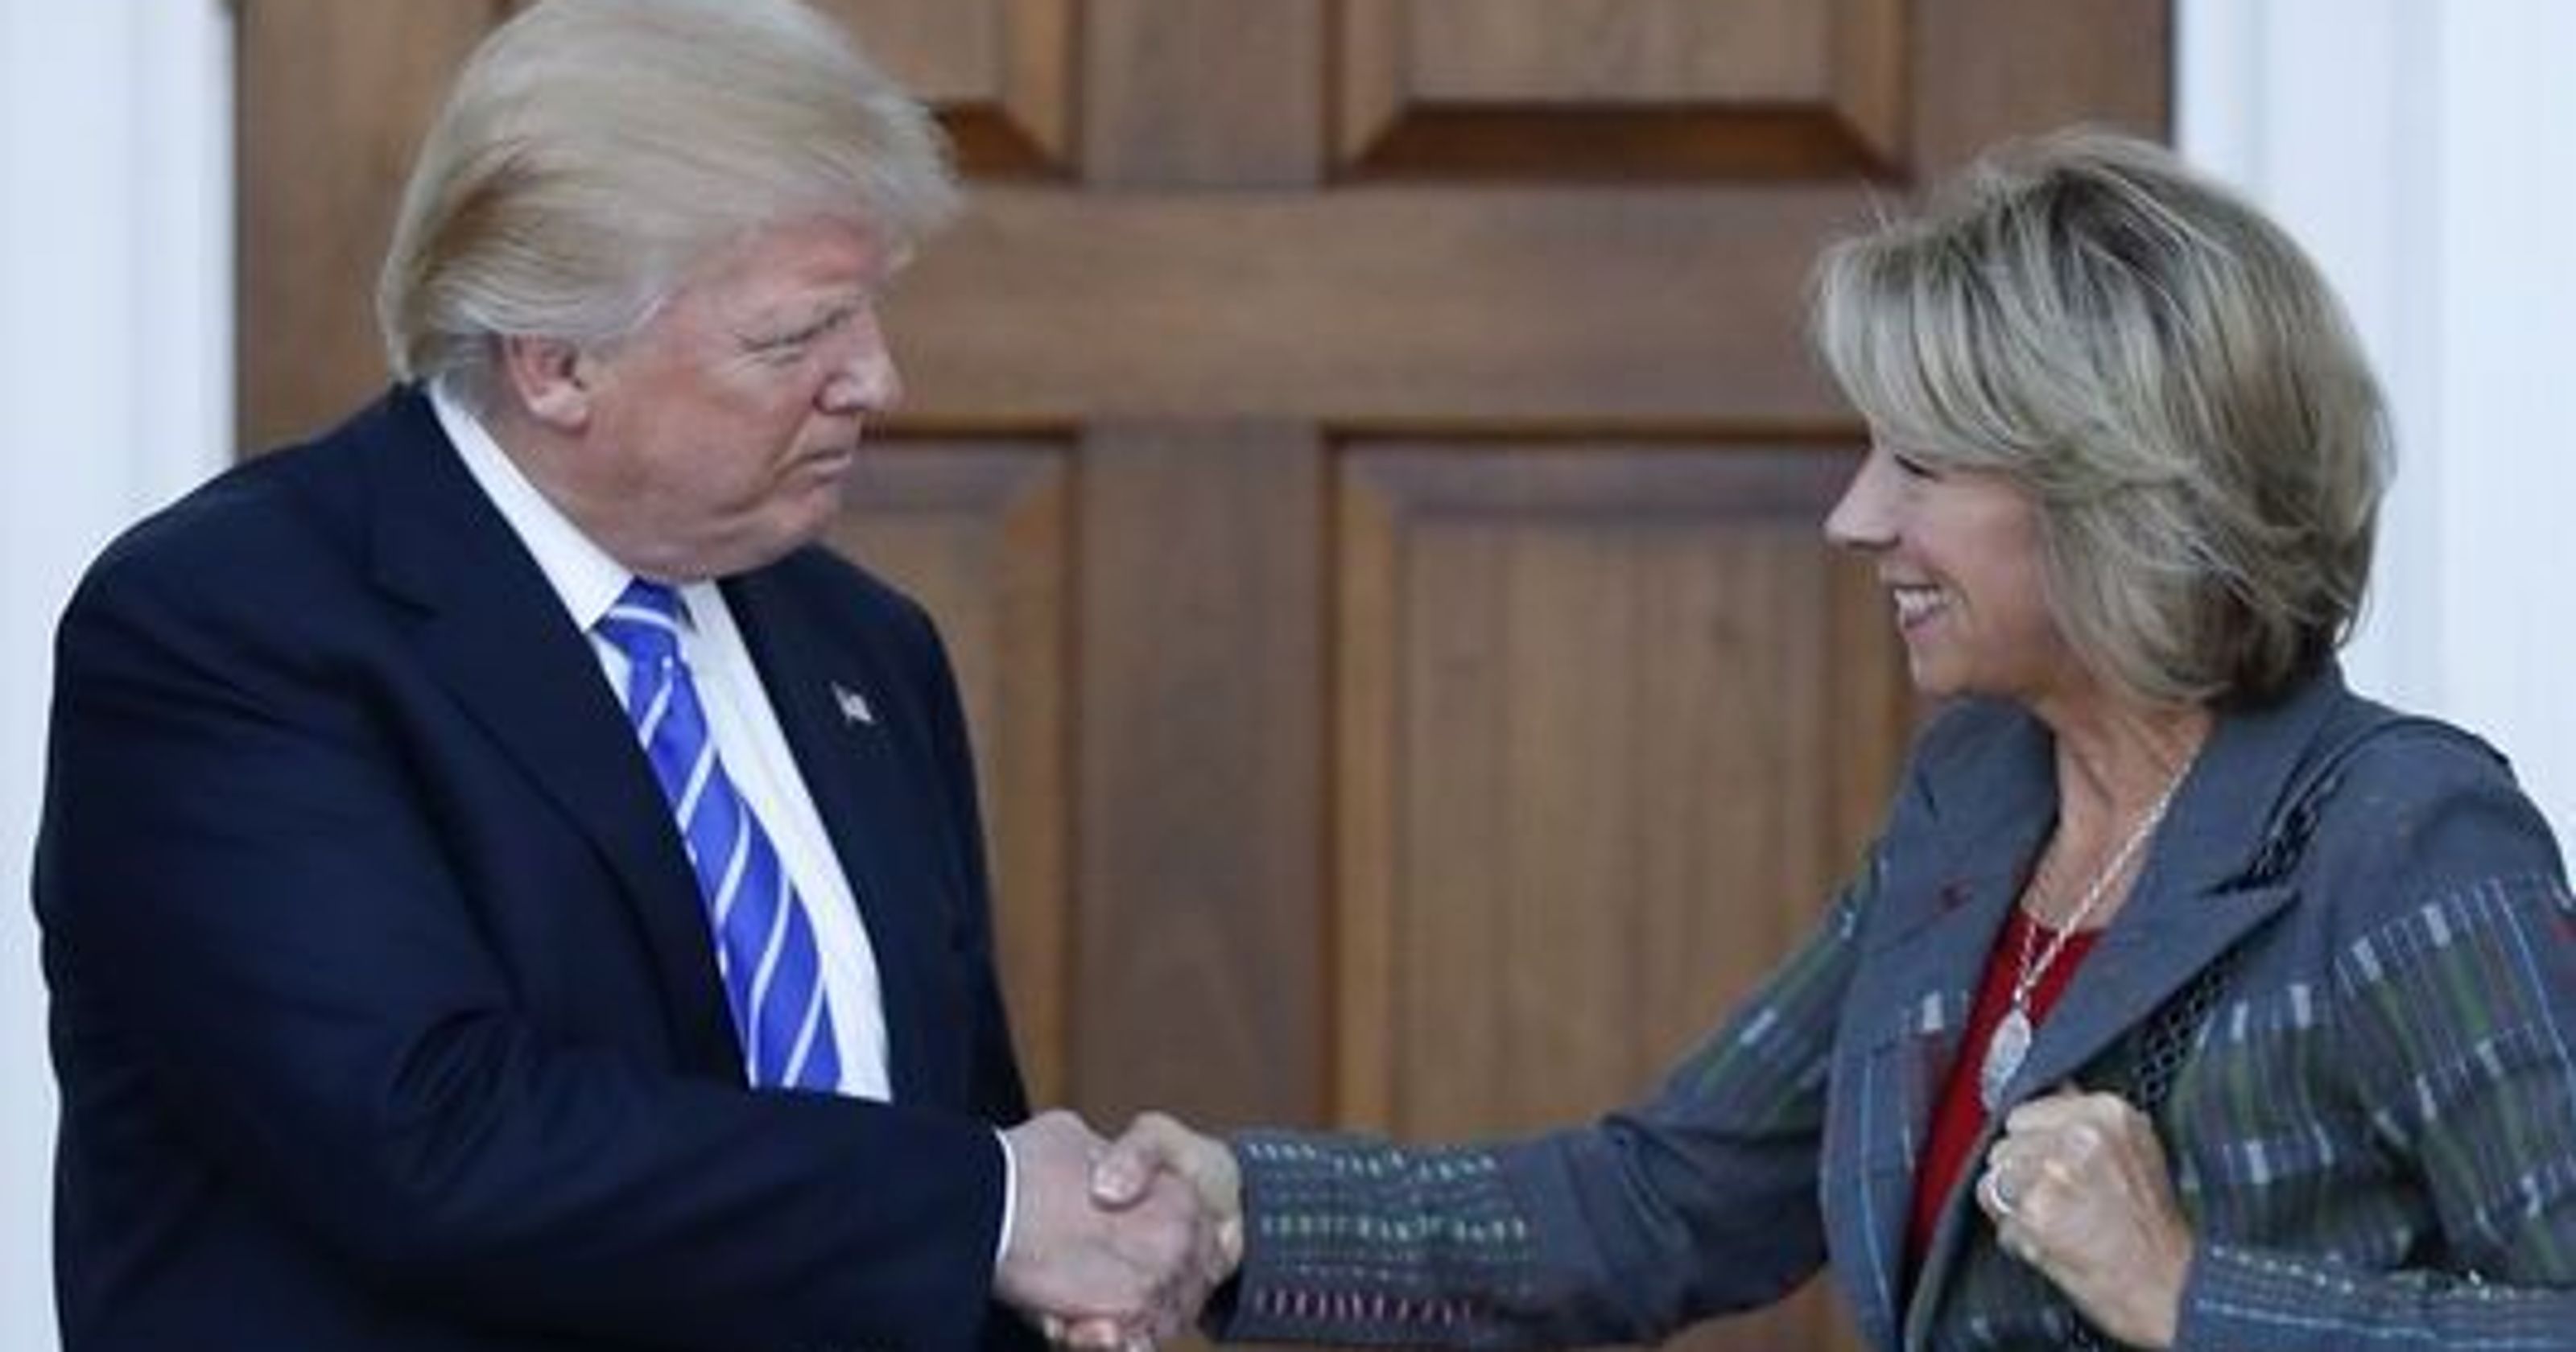
“Options” are taking away money … harming the children left behind. Photo credit: Carolyn Kaster/AP Source: Clarion Ledger
To save this system from the current destructive forces of federal law and those administering their wrath upon this nation’s public schools, a wide-reaching Congressional Oversight Hearing concerning the actions of Secretary DeVos are warranted and necessary as a first step.
Then Congress needs to go back to the drawing board on federal education law and MAKE IT RIGHT this time. The Every Student Succeeds Act (ESSA) did not fix what was wrong with No Child Left Behind.
Excellent piece, Vicky!! Timely, useful and presented in a manner that even I can understand!
Thank you for the compliment, Paul. I hope people will find a way to use the information to explain the true value in maintaining our system of public schools when they make their desires to save that system known to their congressional representatives.
Thank you… This should be required reading, specially for conservatives… but then you would need someone to explain to them what it means
I do hope people will make appointments to see both their state and national representatives to explain why they want to save public schools. Giving our elected leaders a different view of the facts is a good first step.
My advice would be to go slow. These are big concepts and they do go against “conventional wisdom.”
Thank you for taking the time to consider this view.
Pingback: A Clear Plan: The Revolution in School Policy | The Crucial Voice of the PeopleThe Crucial Voice of the People
Thank you for writing this piece, which includes FACTS about the background & history of America’s public schools. Graphs & scores clearly explain truths about student progress & decline, over the years. NCLB & Common Core were devised & mandated by NON-EDUCATORS, yet teachers have been BLAMED for failures of programs. When educational professionals are given the RESPECT & POWER to make decisions on areas of their expertise ( curriculum, discipline & behavior management ), then & only then, will America’s public schools become STRONG, once again!
Thank you for reading this and appreciating facts.
A wise old professor once wrote about “Altering Power Relationships” asserting “that unless changes in power relationships among different levels of educational personnel are concomitant with altering power relationships in the classroom, the goals of reform will not be realized.” He would have appreciated your view, as do I.
Thanks for commenting, good luck out there & keep fighting the good fight. It’s the right fight. 🙂